
Staking Concentration Risk: Why ‘Diversified’ Isn’t Enough
Reading Time - 15 min

On August 4, 2026, BNY Mellon, announced it would route institutional crypto staking through Galaxy’s infrastructure. Galaxy is also one of three validators approved to stake Ethereum for BlackRock’s iShares Staked Ethereum Trust. It runs Solana staking too.
Two of the largest names in traditional finance, leaning on the same infrastructure layer, across two networks.
Nobody decided to concentrate the network. It happened because delegators chose the biggest, most reputable operator. That’s the pattern behind staking concentration risk generally.
In this article, we’re going to walk through:
- What staking concentration risk actually is
- Why “diversified” often just means familiar
- How Polli scores and manages concentration
- What to check in your own portfolio right now
What Is Staking Concentration Risk?
Concentration risk happens when a small group of validators controls a disproportionate share of a network’s stake. When that happens, a handful of operators can effectively stall block production.

In the worst case, they can push through decisions the rest of the network never agreed to.
How do you know when concentration exists and how do you measure it? Two signals matter most.
Nakamoto coefficient
First is the Nakamoto coefficient. The smallest number of validators that would need to fail or collude together to threaten a network. There’s no official regulatory threshold the way there is for HHI, but the logic scales predictably.
A coefficient of 1 means a single validator alone could disrupt the network, true centralization. Below 5 is generally treated as high risk, since that’s a small enough group to coordinate, whether deliberately or through shared failure, without much friction.
The 5 to 15 range is moderate. Above 15 is the healthiest range. An attacker or a shared failure would have to reach more than a dozen independent operators simultaneously, which is a materially harder coordination problem than compromising a handful.
HHI (Herfindahl-Hirschman Index)
HHI is a market-concentration measure borrowed from antitrust economics. It measures how decentralized or concentrated the staked tokens are across the network – among different validators, staking pools, or node operators. It is calculated by squaring each entity’s percentage share of the total staked assets and adding them all together. The result, between 0 and 10,000, is the HHI score.
Here’s the concentration snapshot taken from Polli’s data across the three networks we manage stake on:
- Cosmos Hub: a Nakamoto coefficient of 3 and an HHI of 624. It takes just three validators to reach the one-third threshold that could stop the chain from finalizing blocks.
- Lava: a Nakamoto coefficient of 5 and an HHI of 410. Its active validator set has also shrunk from 96 to 74 over five months, further concentrating the network even without any single validator gaining stake.
- Solana: a Nakamoto coefficient of 18 and an HHI of 101, by a wide margin the healthiest of the three by both measures. The largest single validator holds under 4% of stake, and it takes 18 validators to reach the one-third threshold.
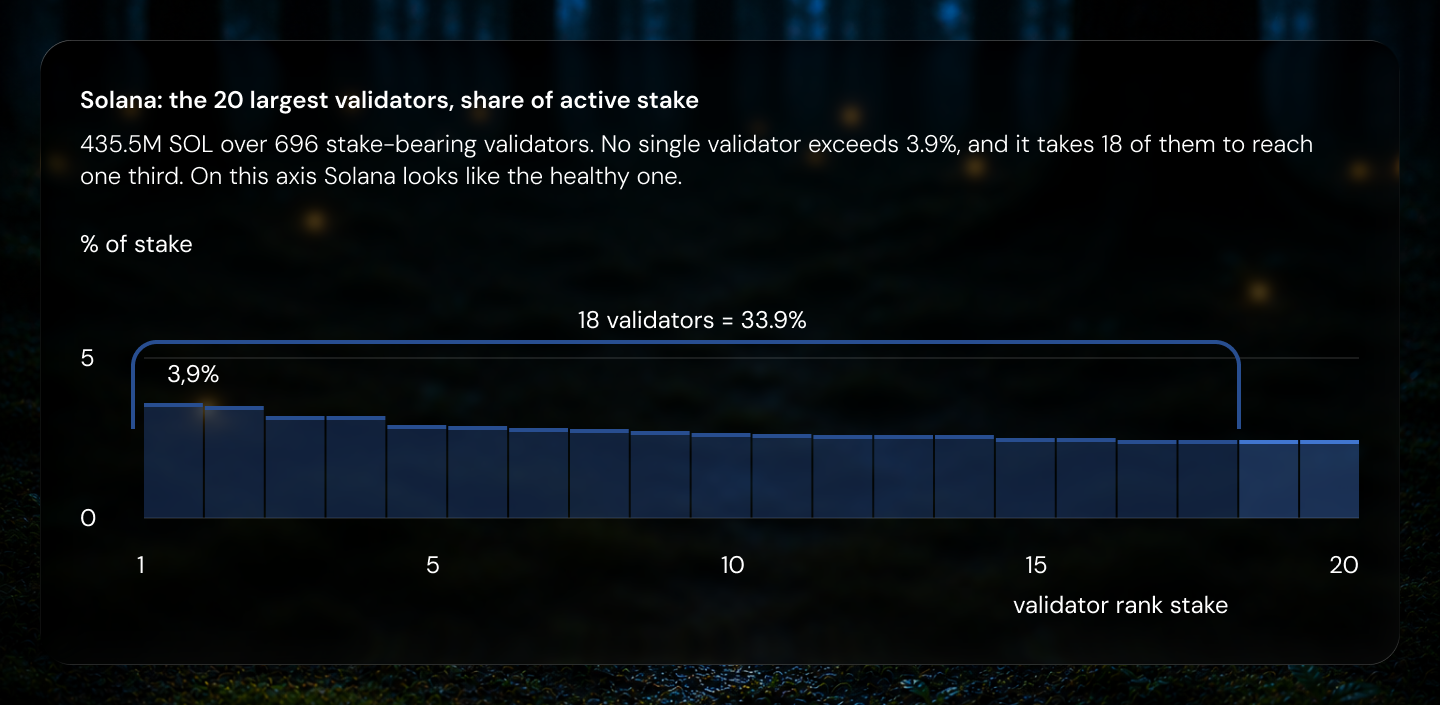
Solana looks like the healthiest network here. And by these two standard measures, it is. But Nakamoto coefficient and HHI both measure validators, not what those validators actually cost you as a delegator.
Ethereum tells the same story from a different angle. According to S&P Global, Ethereum’s Nakamoto coefficient is 2. Lido alone still holds roughly 23-24% of all staked ETH, down from a peak of 32%.
How Concentration Actually Costs Institutions
The concentration risk breaks down into three separate problems for a delegator.
Lost Yield
When delegation concentrates into a handful of large, familiar validators, the cost doesn’t always show up as a dip on a yield chart.
More often, it’s the return you never earned in the first place. Because a smaller validator, less well known but doing just as good a job, would have charged you less for it.
The Solana Foundation’s delegation program has, at various points, matched external stake for smaller validators that keep commission low, part of a deliberate push to support decentralization rather than let it happen by accident.
A validator like Helius, one of the largest on the network, runs at zero commission and is widely considered one of Solana’s best-performing validators.
If your allocation process defaults to whichever validator is the biggest brand name, you can end up leaving money on the floor that a smaller, equally reliable, sometimes better-performing validator wouldn’t have charged you for.
Higher Commission
The same habit that leaves yield on the table also shows up in what institutions pay for infrastructure.
Public Solana validators charge commission across a real range:
- 0%: increasingly common, including among some of the network’s largest and most trusted operators
- 5% to 10%: the range most institutional-grade, brand-name validators sit in
- 100%: self-serving validators that aren’t seeking outside delegation at all, not a mispricing, just a different business model
That 5% to 10% band is the one worth understanding. It’s often justified: these operators run serious infrastructure to support institutional clients, real compliance standards like SOC 2 and ISO 27001, and dedicated teams to service institutional needs.
What’s worth checking is what happens once you put all your delegation into one validator – You’re contributing to concentration risk, for yourself and for the network.
Governance Exposure
Concentration risk isn’t only about yield.
When a few validators control a large share of a network’s stake, they can effectively censor transactions or pass decisions of their own because they hold the voting majority. Nobody else’s agreement is required.
The bigger risk is that you don’t know what happens to a validator over time. It can get hacked, get acquired by a party with bad intentions, or simply fail. Concentrating delegation into a few validators increases how much damage any single one of those events can do to the network.
This is exactly why blockchain networks were built for decentralization in the first place.
This is also one of the more underrated arguments for decentralization generally. Attacking a network concentrated behind a small validator set is cheaper and easier than attacking one spread across many independent operators, whether the threat is conventional today or a more capable adversary like a quantum computer down the line.
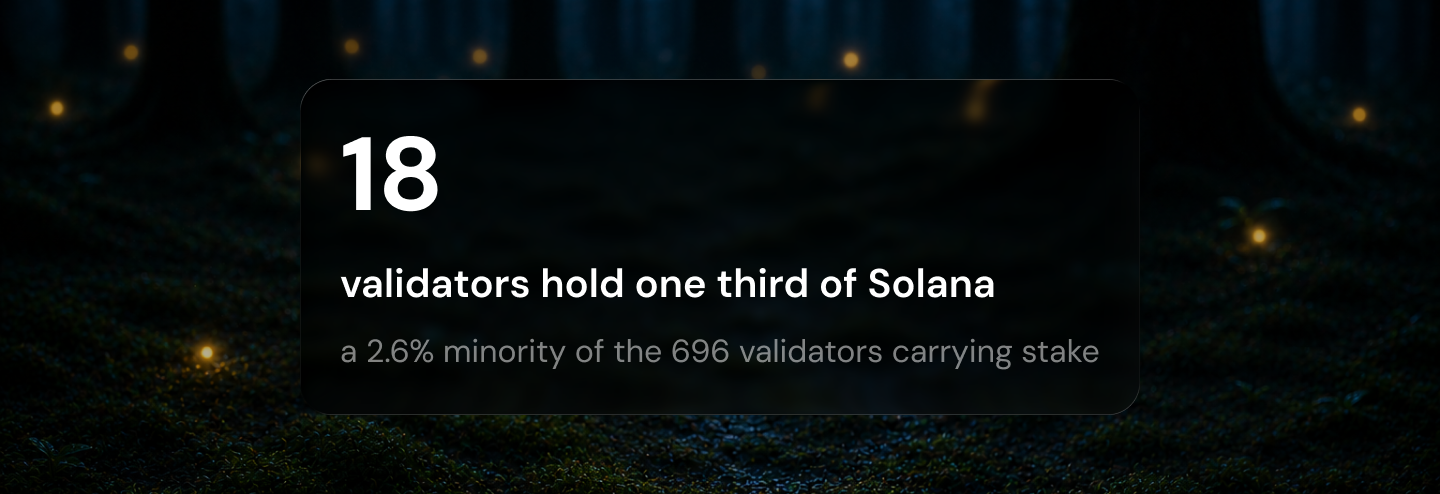
On Solana specifically, it takes 18 validators to reach the one-third threshold where a coordinated group could threaten the network, a small enough number that it’s worth taking seriously.
Why “Diversified” Often Just Means Familiar
When institutions say they’re diversified, what they usually mean is they’re not putting all their eggs in one basket, at least not by name.
Next, they typically focus on institutional brand names. They diversify across big, recognizable validators. Whether that’s fully justified is a fair question. These institutions want reliable infrastructure, which matters, and brand names deliver it.
But there’s a wider field they’re not looking at.
Many more institutional-grade validators do a phenomenal job but simply aren’t big brand names. They’re extremely reliable. Sometimes more reliable than the brand names, and they don’t show up on anyone’s shortlist.
Based on Polli’s scoring data, the top 20 performing validators are not the same set as the top institutional brand names. Some of those brand names aren’t even in the top 50 by performance. They’re spread somewhere between the top 50 and the top 150.
Diversifying across recognizable names solves single-point-of-failure risk.
How Polli Scores Validators
Not all validators are created equal. Plus, none of them perform the same way epoch after epoch. Some get better, some get worse, and it changes constantly.
That’s exactly where Polli comes in.
Concentration is one of the things we score for directly:
- Concentration: more voting power means a lower score, regardless of how well the validator otherwise performs.
- Commission: a well-run institutional operator charging 5 to 10% is scored differently than an operator charging the same with nothing to show for it.
- Uptime and MEV (Maximal Extractable Value) capture: most validators handle uptime well, far fewer handle MEV consistently, a smaller but real source of return left on the table more often than commission is.
- Operational depth: validators that actively manage client selection and diversify their own infrastructure are a small subset of the field, and don’t always match the “top 20 by brand” list institutions default to.
None of this is a one-time allocation decision. Scoring only matters if something acts on it. This is what redelegation does: moving stake away from a validator when its score, commission, or concentration profile changes, without waiting for a quarterly review to catch it.
Here’s what that scoring actually produces on three networks we manage stake on:
- Cosmos Hub: The network puts 56.6% of its stake in its 10 largest validators. Our managed stake puts just 9.4% there, a 47% gap, spread across 108 of the network’s 180 validators.
- Lava: The network puts 52% in its 10 largest validators. Our managed stake is 42.8%, a narrower gap since Lava is less top-heavy to begin with, but it points in the same direction.
- Solana: The network puts 33.9% in its 18 largest validators. Our managed stake allocates 1.2% to superminority validators and 98.8% to 170 validators outside that group.
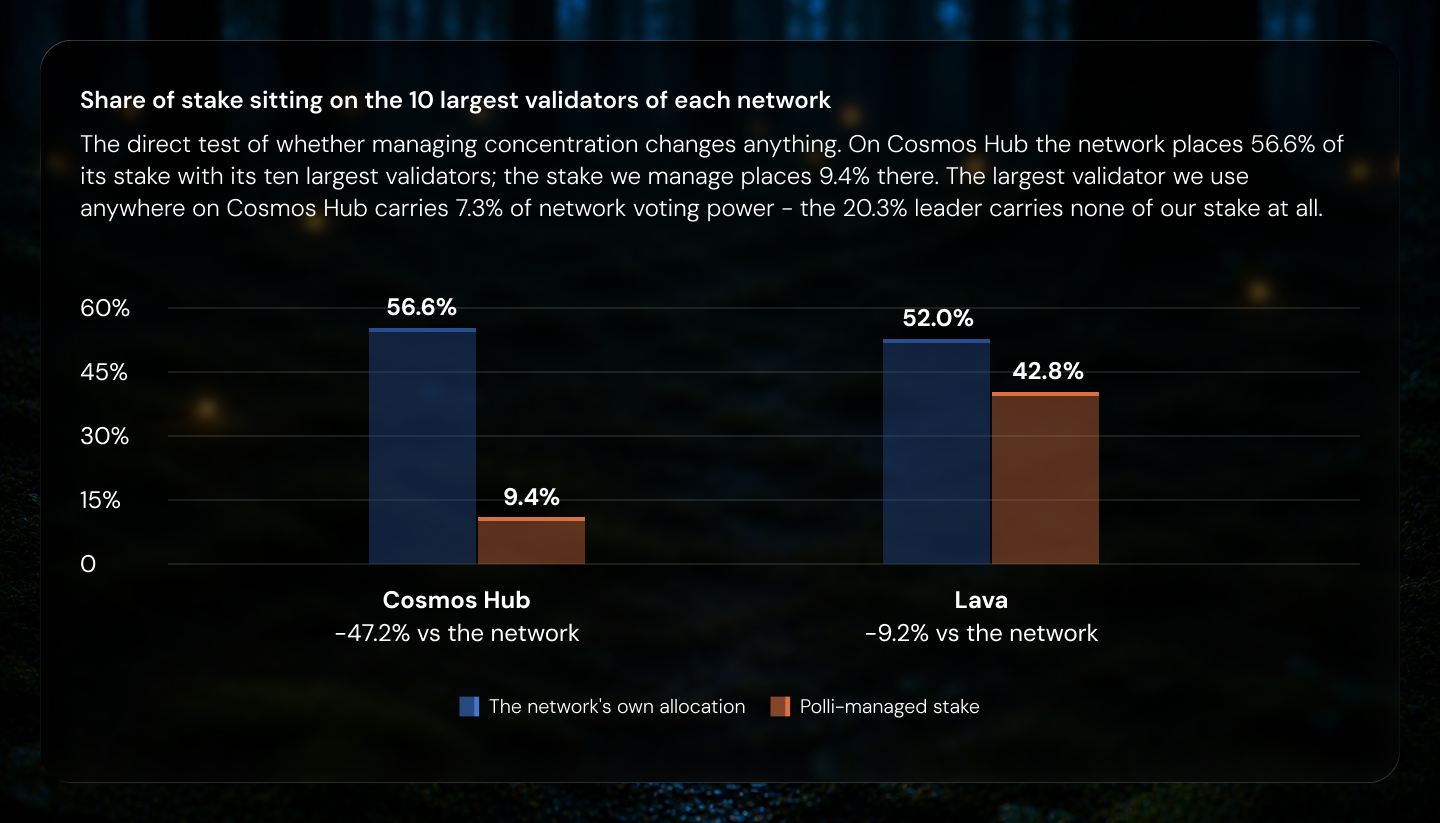
Across Polli’s data, concentration risk is one of the leading reasons for redelegation. We built Polli to run these checks and redelegate continuously and automatically.
But the checks themselves are worth knowing whether or not you’re using a system to run them.
What Should Institutions Check in Their Own Portfolio?
Here’s what to look for in your own allocation right now:
- Look underneath the validator, not just at it: ask which hosting provider and physical location sits behind each name in your delegation set
- Check commission against the justified range: 5 to 10% for genuinely institutional-grade infrastructure; scrutinize anything higher
- Track Nakamoto coefficient and HHI as a trend: a single read shows where a network is, watching it over months shows whether concentration is building
- Decide whether your diversification target is validators, infrastructure, or both: if it’s only validator count, you may already be exposed to the kind of correlated failure
A team can spend two months evaluating five validators, choose well, and still be exposed six months later. A shared dependency can fail at 2 am somewhere nobody’s watching, or a validator can quietly change infrastructure providers.
Static analysis answers a point-in-time question. But the concentration risk is a moving target.
For the full picture of what we track across institutional staking, read our piece on the four risks hiding in institutional staking.
Frequently Asked Questions
How does Polli address concentration risk?
Concentration is a direct, negative input to our validator scoring, alongside commission, uptime, and MEV (maximal extractable value) performance. On Solana, infrastructure decentralization is a tunable weight in our allocation engine. We monitor and rebalance continuously rather than allocating once and leaving it.
What is the Nakamoto coefficient?
The smallest number of validators that would need to fail or collude together to disrupt a network. The higher the number, the harder the network is to attack or take over.
What is HHI?
Short for Herfindahl-Hirschman Index, a measure of market concentration borrowed from antitrust economics. It’s calculated by squaring and summing each validator’s share of stake. The lower the score, the more spread out the network’s stake is.
What commission rate is normal for an institutional validator?
5% to 10% is typical for genuinely institutional-grade infrastructure. Rates near 0% are increasingly common too and aren’t automatically a red flag. Rates well above 10% deserve scrutiny.
Note: This material is for informational purposes only and does not constitute investment advice or a recommendation. Case examples are historical and illustrative; they do not project or guarantee future results.

August 21, 2026
August 31, 2026